CTC Facility Aggregate Report
Print
Modified on: Tue, 14 Jul, 2026 at 6:51 AM
The CTC Facility Report compares your facility’s results to peer and national benchmarks, helping you identify opportunities for improvement.
Reports are posted four times a year with cumulative results for a calendar year.
Click the Aggregate Reports menu item on the NRDR Homepage Facility Management menu to generate a table of reports available for download. A sample report is available here.
CT Colonography Summary Table
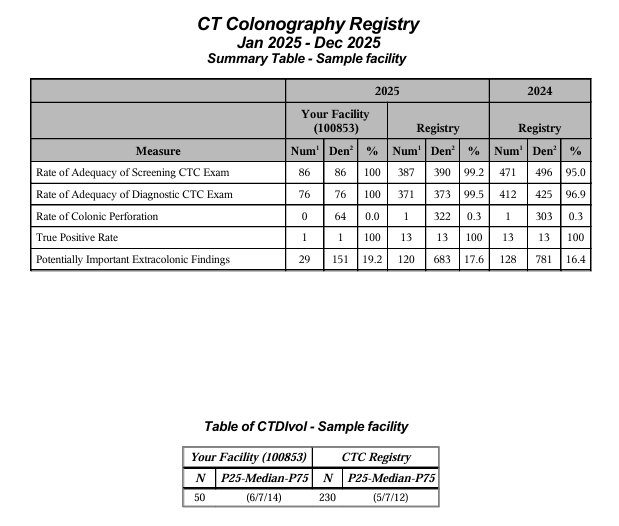
The Summary Table shows results for each CTC measure for your facility compared to the entire CTC registry in the current calendar year, and to the entire CTC registry for the previous year. Each row shows the numerator (instances), denominator (eligible for measure), and rate for each measure.
A table at the bottom provides CTDIvol quartiles for your facility and the entire registry.
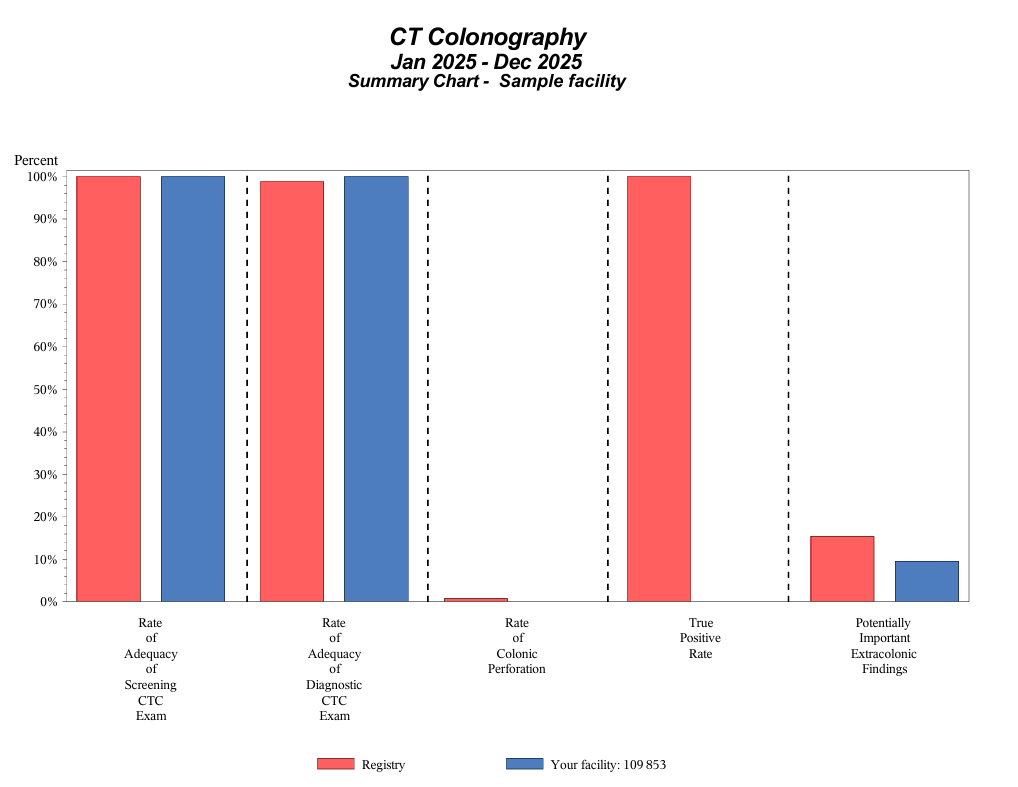
Charts
The summary chart compares rates for your facility with the entire registry for each CTC measure.
Trend charts show the change in rates over time, by reporting period, for your facility and the CTC registry, for each measure. The trendlines denote the median measure rate and the “whisker” markers highlight 95% confidence intervals.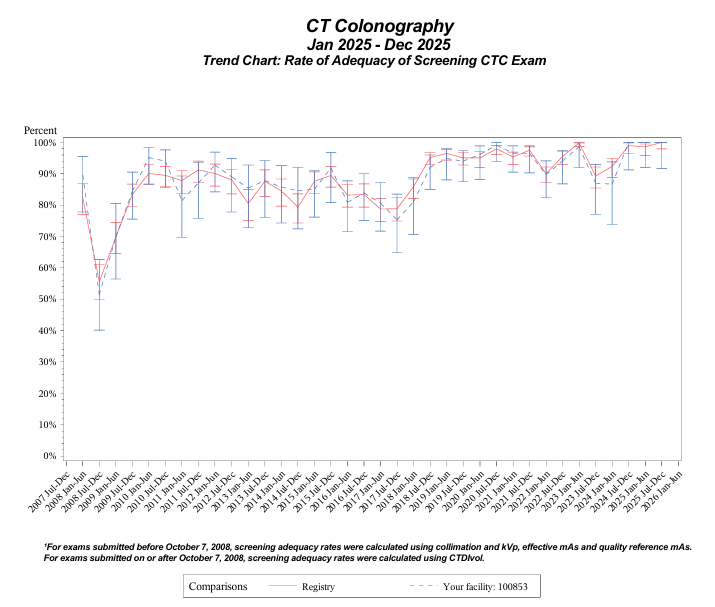
Did you find it helpful?
Yes
No
Send feedback Sorry we couldn't be helpful. Help us improve this article with your feedback.

